- Join Our Company
- Email: sanjay@pjnetworks.com
- Phone: +91-9818361787


Slide four of the quarterly security deck shows a bar chart of millions of events “analysed”. Slide five shows thousands of threats “blocked”. The audit committee chair nods politely, then asks the only question that matters to her: if someone got into our network last month, how quickly would we have known, and what would it have cost us?
Nobody in the room has a clean answer. The SOC counted what was easy to count.
We run a 24/7 NOC and SOC from Delhi, and rebuilding SOC metrics for board reporting is something we end up doing early in a lot of engagements. The raw data is usually fine. The problem is the selection, the definitions and the missing context, and those are fixable in a quarter.
The short answer: a board needs five to seven SOC metrics, not fifty. Report how fast serious incidents were detected and contained, how much of your critical estate actually sends logs to the SOC, which attack techniques you can and can’t detect, whether the CERT-In six-hour reporting clock was met, and how long high-risk exposures stay open. Everything else belongs in the monthly operations review.
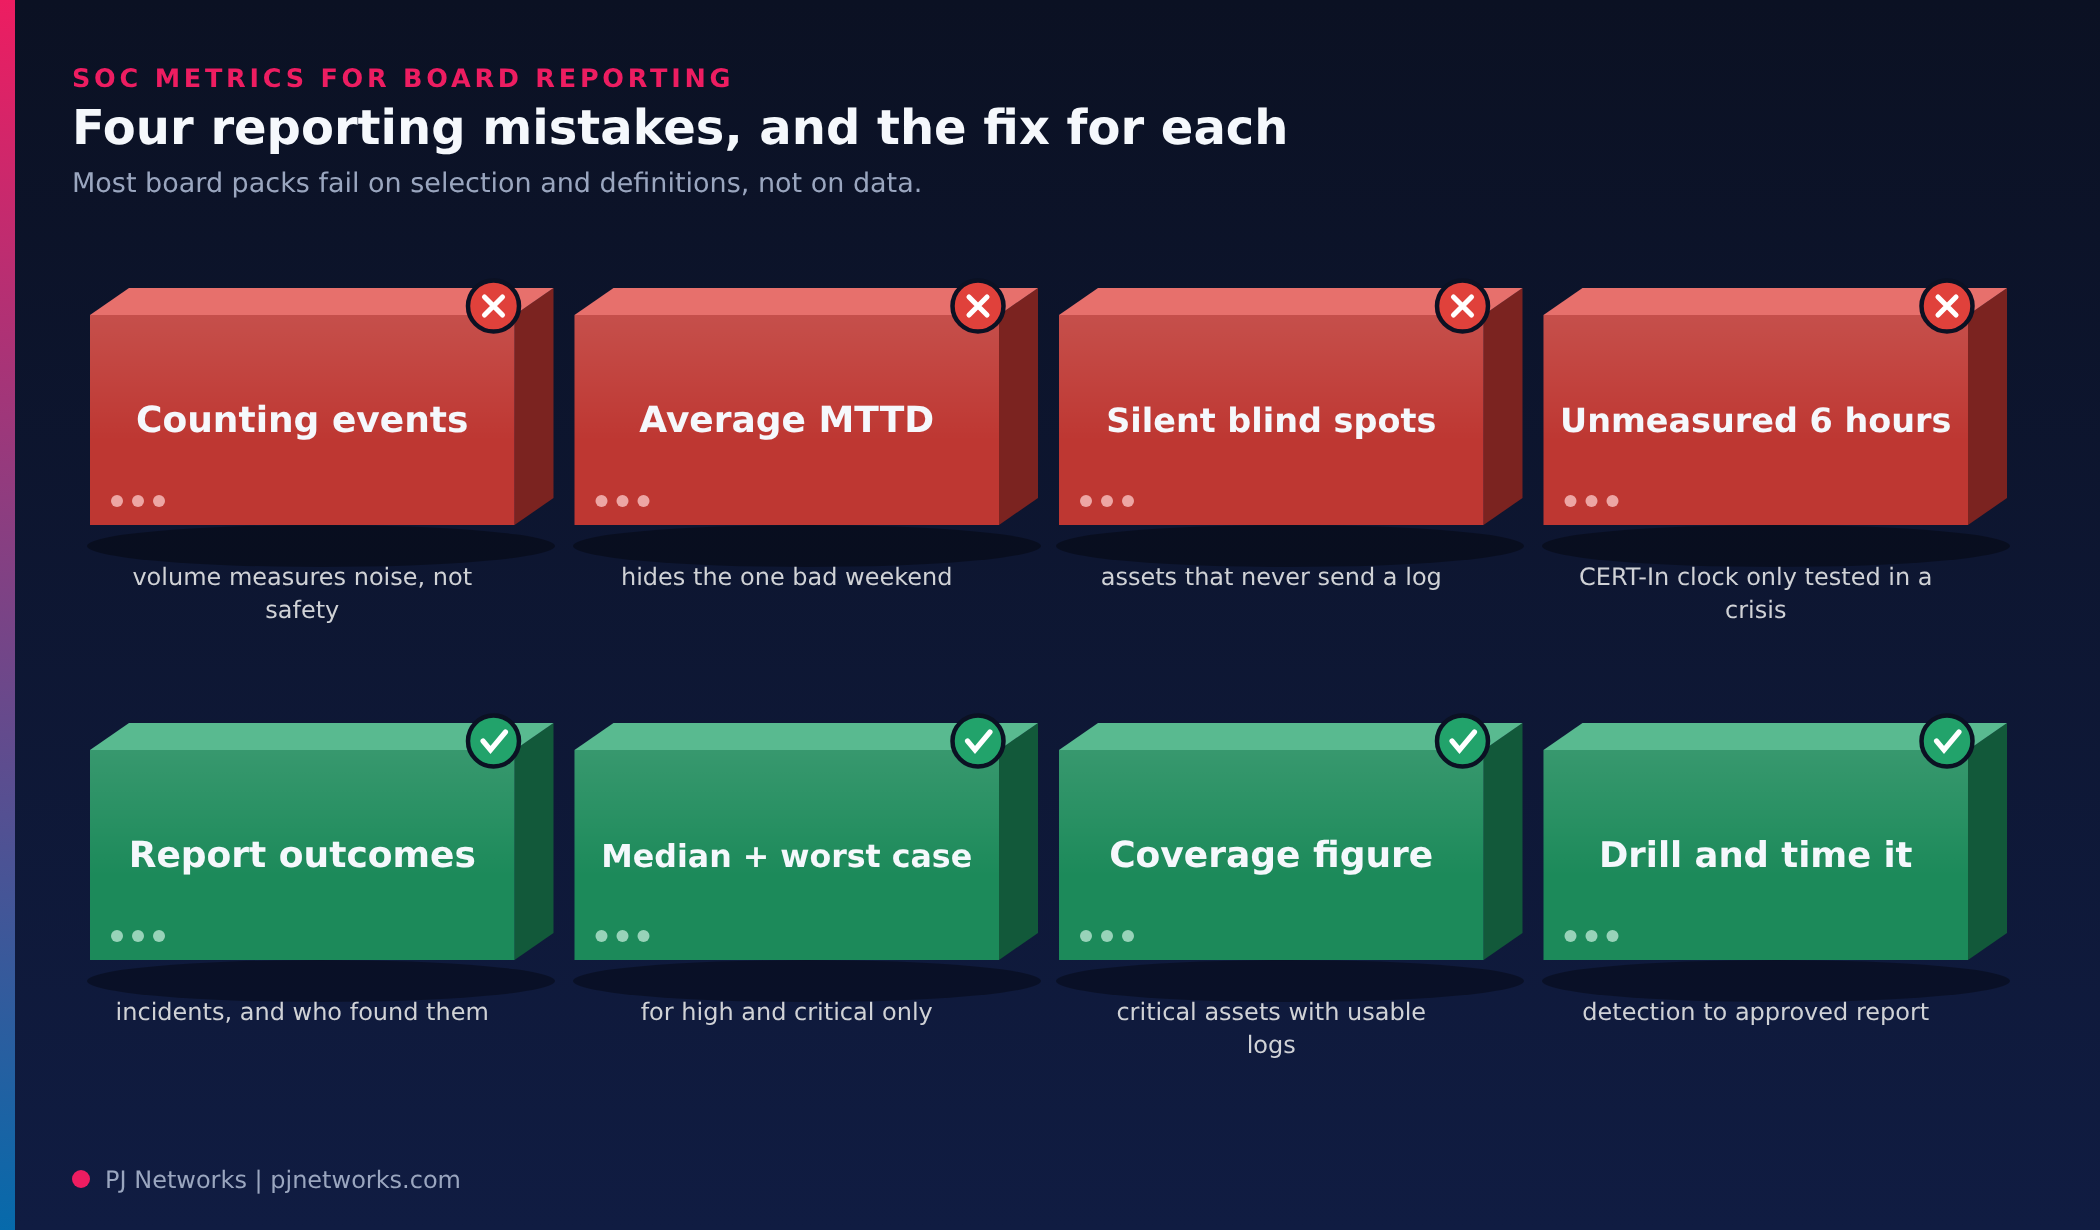
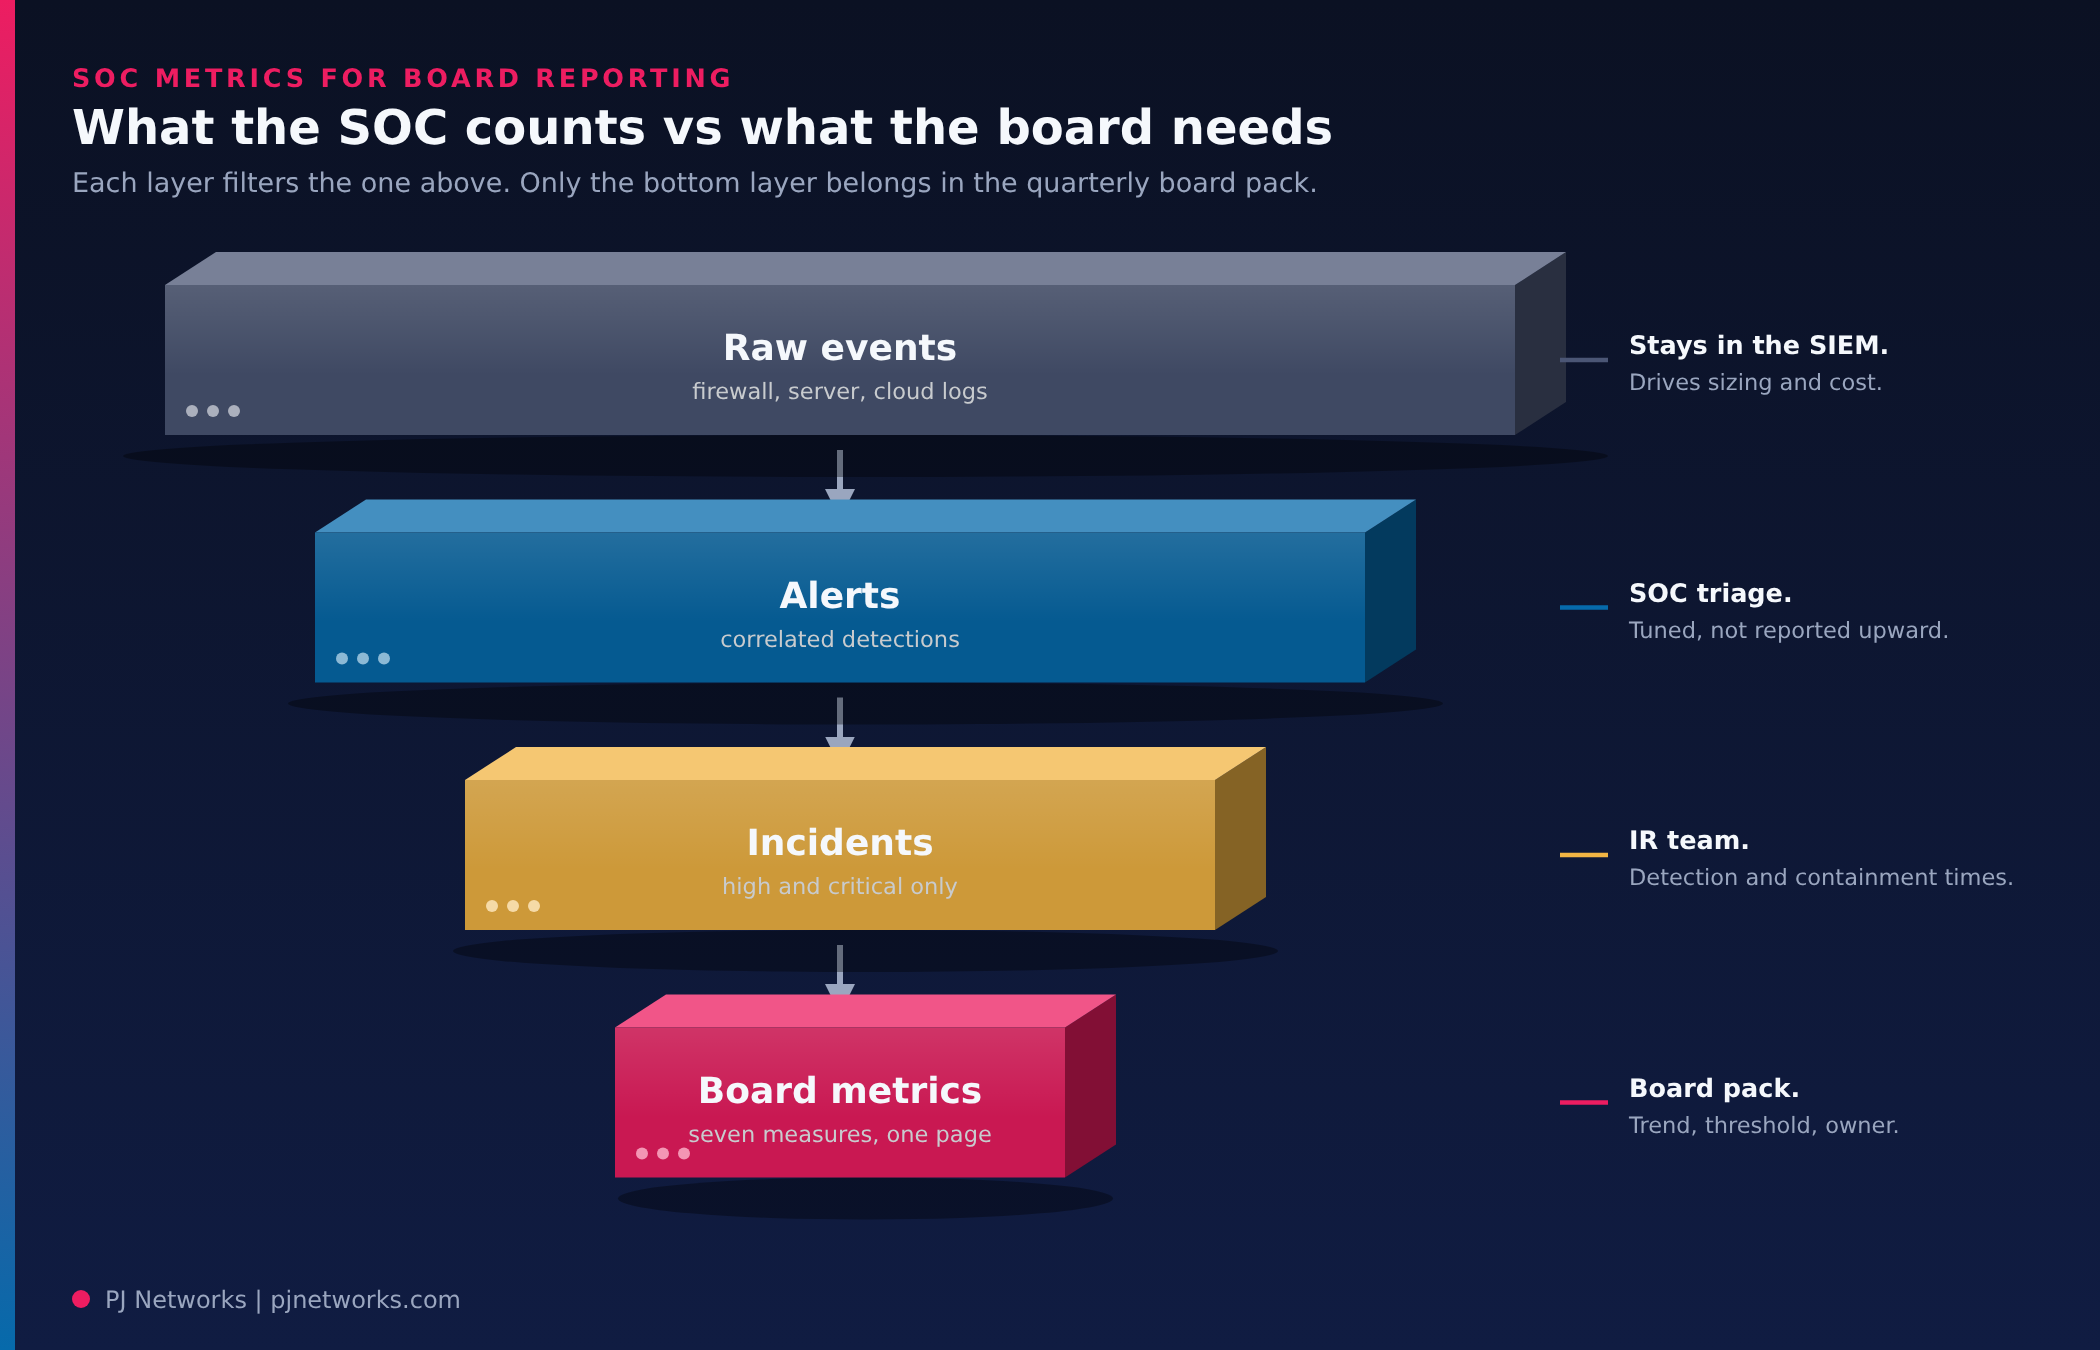
Event volume is a measure of how noisy your environment is, not how safe it is. A FortiGate at a busy plant will generate more log lines than one at a quiet sales office, and a firewall that blocks a lot of port scans is doing what every firewall does. When a board sees “threats blocked” go up, it can’t tell whether things got worse, the SOC got better, or someone simply turned on more logging.
We’d drop these numbers from the board pack entirely.
The fix is to report outcomes. How many incidents reached high or critical severity this quarter? How many of those were found by the SOC, and how many were reported by a user, a vendor or a customer first? That second split is uncomfortable, and it’s the most honest single figure a SOC can show. If your staff or your bank found the problem before your monitoring did, the board should know.
Mean time to detect (MTTD) and mean time to respond (MTTR) are the two metrics every vendor puts in a proposal. They’re useful, but an average across all alerts flatters you. Hundreds of quickly closed low-severity tickets drag the mean down, while the one ransomware precursor that sat unnoticed over a long weekend disappears into the arithmetic.
Report detection and containment time for high and critical incidents only, and show the median plus the worst case.
This is where it usually goes wrong. Does detection time start when the attacker’s first action happened, when the log arrived in the SIEM, or when an analyst opened the alert? Each answer gives a very different number. We start the clock at the earliest malicious event we can reconstruct afterwards, because that is what a forensic investigator or a regulator will do. It makes our numbers look worse. It also makes them believable.
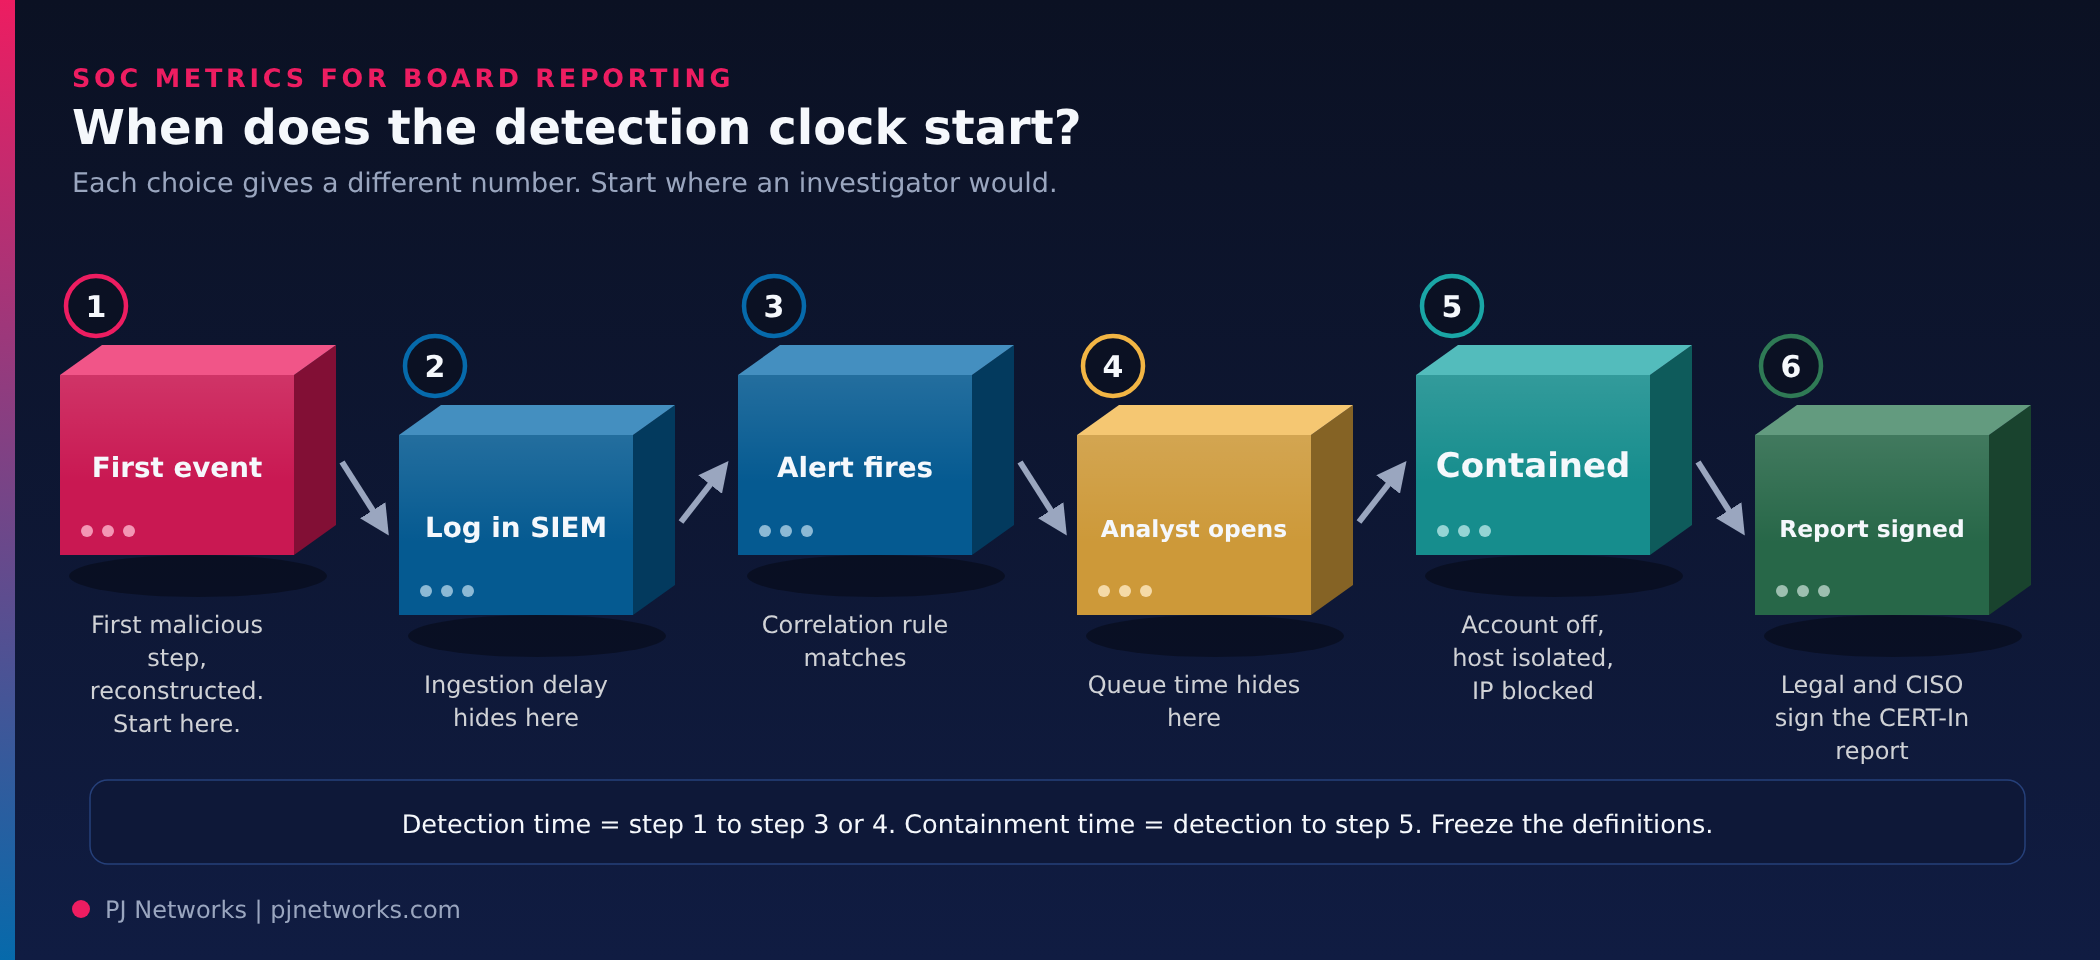
Containment needs the same discipline. Write down what “contained” means: account disabled, host isolated, IP blocked at the FortiGate, or all of these. Freeze the definitions, or the trend line means nothing.
A SOC with a perfect detection time is still blind to any system that never sends it a log. In Indian mid-market estates, the usual gaps are predictable: branch firewalls on a single broadband line that were never pointed at the central collector, a plant’s OT network that IT isn’t allowed to touch, a cloud ERP whose audit logs need a separate subscription, and domain controllers where nobody enabled the right audit policies.
So the board should see a coverage figure: of the assets you’ve classified as critical, what percentage sent usable logs to the SOC every day this quarter? “Usable” matters. A firewall sending only traffic summaries, with no VPN or admin login events, technically reports in but can’t support an investigation. We covered the retention side of this in our piece on how long firewall logs need to be kept in India, and the same branch boxes tend to show up in both problems.
A second coverage view is worth adding once the first is stable. Map your detection rules against the MITRE ATT&CK techniques that matter for your sector, and show which ones you can detect, which you can only investigate after the fact, and which you can’t see at all. Don’t chase full coverage. A manufacturer worried about ransomware should care far more about credential dumping and remote execution than about obscure persistence tricks.
The CERT-In directions of April 2022 require specified cyber incidents to be reported within six hours of being noticed. Most companies treat that as a legal clause rather than an operational target, and then find out during a real incident that the people who must approve the report are on a flight, or that nobody knows which incidents qualify.
Turn it into a metric. For every reportable incident, and for every tabletop exercise, record the time from detection to a report that legal and the CISO have signed off. If you had no reportable incident this quarter, report the exercise result instead. Our guide to cyber incident reporting across Indian regulators lists the overlapping timelines for banks, insurers and listed entities, which is where this gets messy.
Would your team make six hours at 2 a.m. on a Sunday? If you don’t know, that is itself the finding.
The other common failure is a number with no target and no owner. A board can’t act on “MTTD: 7 hours” unless it knows whether 7 is good, what the target was, and who is fixing it. Every metric in the pack should carry a threshold (green, amber, red) agreed with the CISO, and a named owner for anything in amber or red.
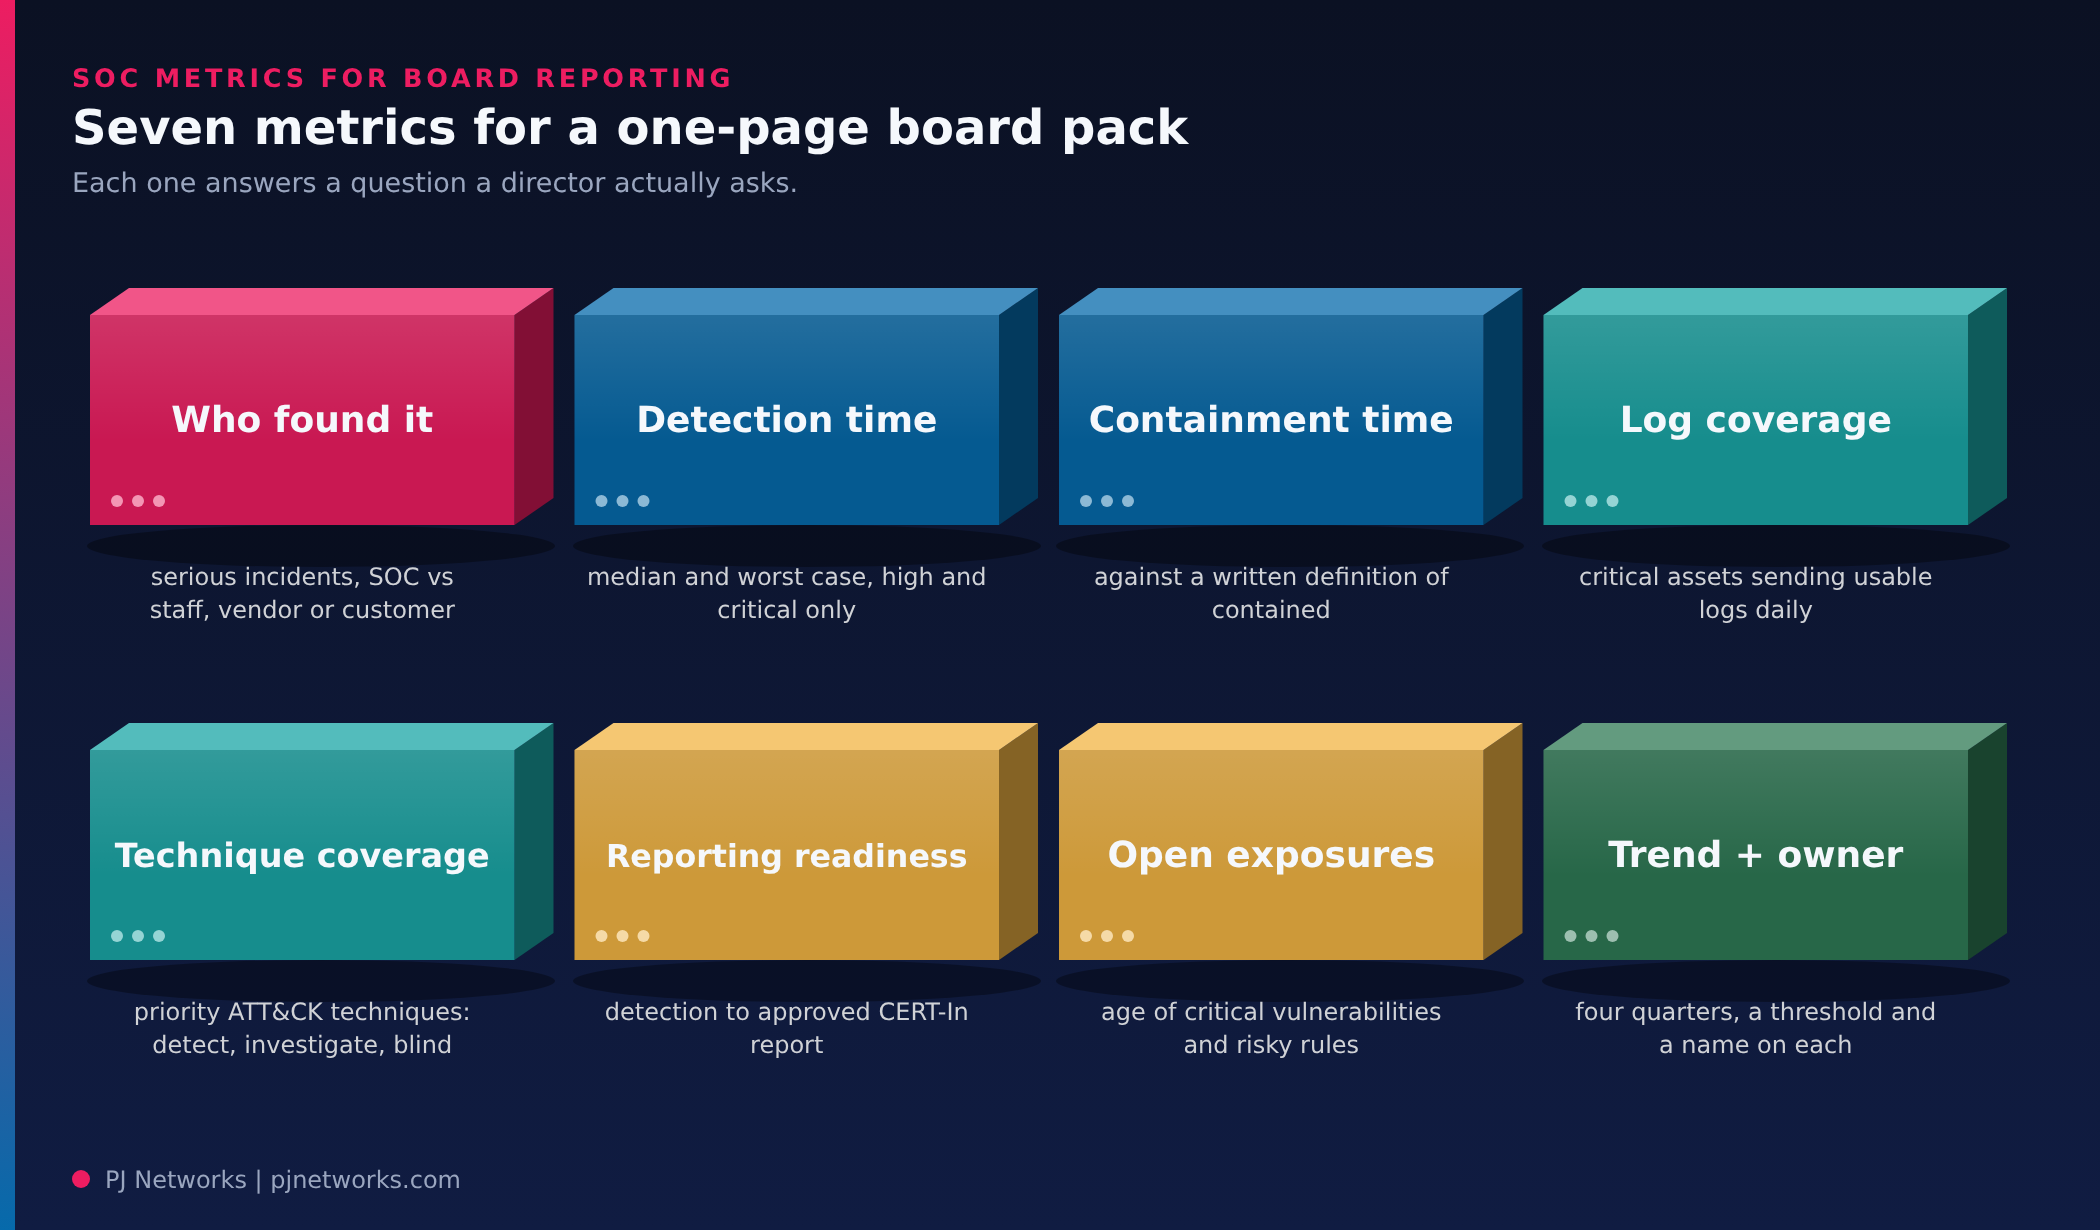
Here’s the pack we’d start with. It fits on one page, and each line answers a question a director would actually ask.
| Metric | Question it answers for the board | How to measure it | Usual owner |
|---|---|---|---|
| Serious incidents, and who found them | Are we catching problems ourselves? | High and critical incidents, split by SOC-detected vs reported by staff, vendor or customer | SOC lead |
| Detection time, high and critical | How long could an attacker go unnoticed? | Median and worst case, clock starting at first reconstructed malicious event | SOC lead |
| Containment time, high and critical | Once we knew, how fast did we stop it? | Median and worst case, against a written definition of “contained” | IR lead with IT operations |
| Critical asset log coverage | What can’t we see? | Percentage of critical assets sending usable logs daily, with named gaps | Infrastructure head |
| Detection coverage of priority techniques | Would we notice the attacks that hurt companies like us? | Priority ATT&CK techniques: detected, investigable only, blind | Detection engineering |
| Regulatory reporting readiness | Can we meet CERT-In’s six hours? | Detection to approved report, from real incidents or drills | CISO with legal |
| Open high-risk exposures | Are known holes being closed? | Count and age of critical vulnerabilities and risky firewall rules past their due date | IT head |
Show each line as a four-quarter trend, and add one sentence under the table on what the SOC changed because of these numbers.
If you’re a SEBI-regulated entity, part of this work is already required. The Cybersecurity and Cyber Resilience Framework (CSCRF) that SEBI issued in August 2024 expects regulated entities to have SOC monitoring, and asks for the SOC’s functional efficacy to be measured: half-yearly for market infrastructure institutions and qualified entities, and yearly for others through their SOC provider. The framework gives an indicative list of parameters for that assessment.
Our advice is to build the board pack and the efficacy assessment from the same data and the same definitions, so you aren’t maintaining two versions of the truth. If you’re working through the wider framework, our SEBI CSCRF compliance services page sets out how we approach it.
The hardest part of honest SOC metrics is stitching the data together. Detection times live in the SIEM, containment in a ticketing tool, asset lists in a spreadsheet, and log gaps in nobody’s report. PrahiX Ora is the platform we deploy and operate to close that gap. PrahiX Tech Pvt Ltd builds it as a unified SecOps platform, and PJ Networks is its primary field deployment and operations partner. Here is which part of Ora feeds which line of the board pack.
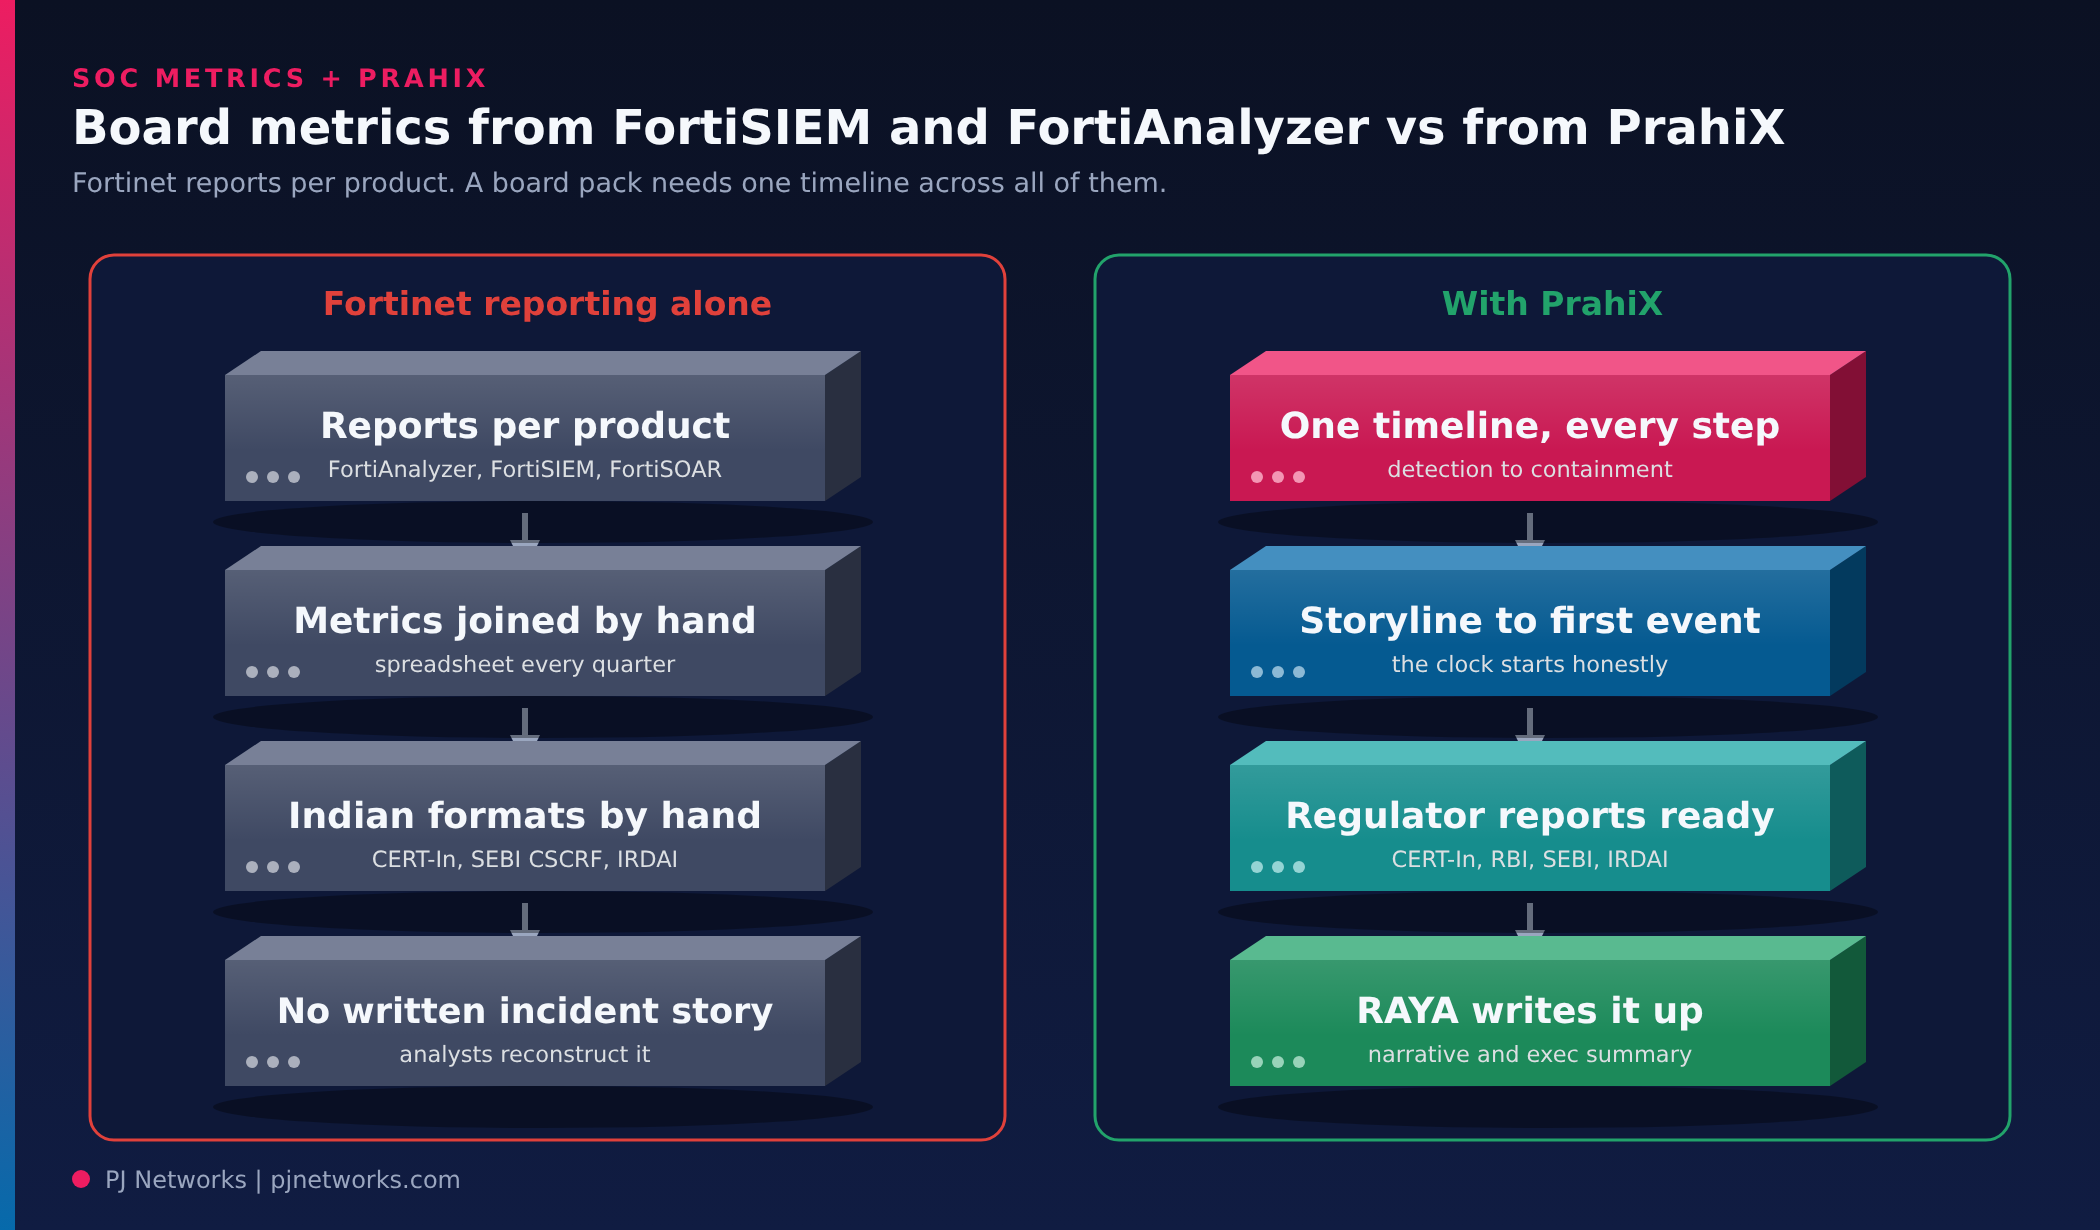
Many Indian SOCs run on FortiAnalyzer, often with FortiSIEM and FortiSOAR beside it. Each produces good reports about its own data. The board pack is where the joins show, because every metric in it crosses at least two of those products.
| With Fortinet reporting alone | With PrahiX |
|---|---|
| FortiAnalyzer, FortiSIEM and FortiSOAR each report on their own data | Detection, correlation, response and evidence on one timeline, so every metric comes from the same record |
| Detection and containment times joined by hand in a spreadsheet each quarter | Every step from first event to containment timestamped in one place |
| CERT-In, SEBI CSCRF and IRDAI submissions usually assembled by hand | CERT-In, DPDP Act, RBI, SEBI CSCRF and IRDAI mapped, with submission-ready reports and breach clocks that start when an incident is logged |
| Incident write-ups reconstructed after the fact | RAYA writes the incident narrative and an executive summary as the incident is handled |
| Alert volume reported because it is easy to count | Correlation that cuts alert noise by up to 70%, and an immutable audit trail of every analyst step |
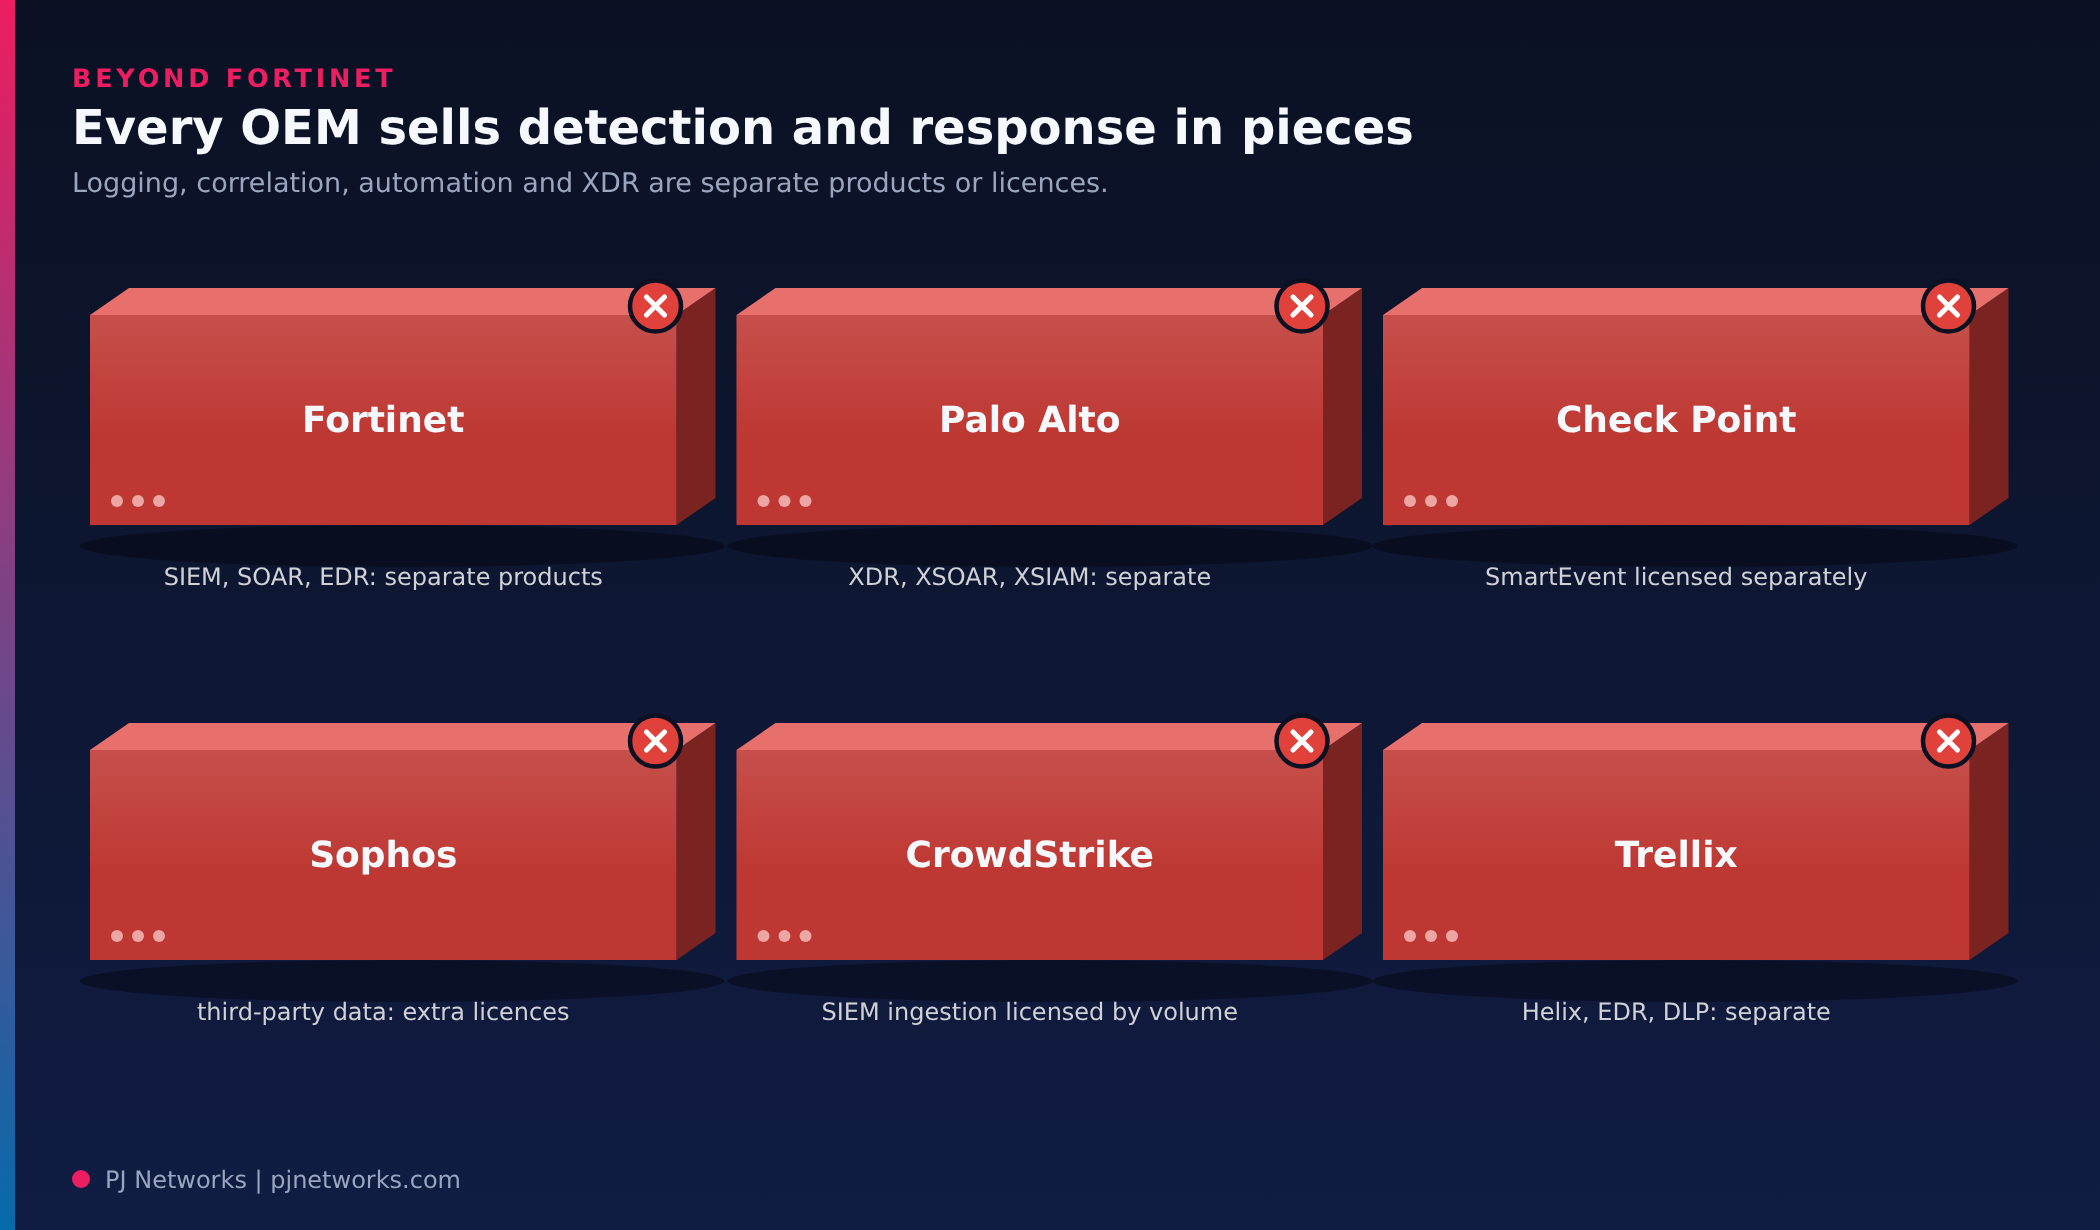
This gap isn’t specific to Fortinet. Each major OEM splits logging, correlation, automation and endpoint response into separate products or licences, usually tuned to its own telemetry first.
| OEM | What you get, and where it stops |
|---|---|
| Fortinet | FortiAnalyzer, FortiSIEM, FortiSOAR and FortiEDR are separate products joined by Security Fabric connectors |
| Palo Alto Networks | Cortex XDR, XSOAR and XSIAM are separate products, and Strata Logging Service retention depends on the storage bought |
| Check Point | SmartEvent correlation is a separately licensed blade sized in correlation units; Infinity XDR/XPR is another subscription |
| Sophos | Sophos XDR and MDR are built on Sophos telemetry first; third-party sources need integration licences |
| CrowdStrike | Falcon Next-Gen SIEM is a module with third-party ingestion licensed by volume; network device health is outside it |
| Trellix | Helix, EDR, ePO and DLP are separate Trellix products under one XDR umbrella |
| PrahiX | SIEM and SOAR on one engine, logs from any vendor, NOC and SOC on one timeline, Sigma detections mapped to MITRE ATT&CK, UEBA, 180-day retention and compliance mapping for CERT-In, DPDP, RBI, SEBI CSCRF and IRDAI. |
ISO 27001, NIST CSF, CIS Controls v8 and PCI-DSS are mapped too, which helps when the board pack and the auditor’s checklist have to agree. FortiGate and FortiAnalyzer stay in place as sources. More on PrahiX Uni and RAYA AI.
| Board metric | Where it comes from in Ora |
|---|---|
| Serious incidents, and who found them | SIEM correlation and incident records, with the source of each detection kept |
| Detection time | Graph-based attack storyline that rebuilds the sequence back to the first malicious event |
| Containment time | SOAR playbook timestamps for each response action, synced to your ITSM tool |
| Critical asset log coverage | NMS and asset inventory, showing which devices are reporting |
| Detection coverage | Correlation rules mapped to MITRE ATT&CK tactics and techniques |
| Reporting readiness | SOAR notification playbooks and incident reporting |
| Open high-risk exposures | Configuration and asset management, with compliance reporting |
The SIEM ingests syslog, NetFlow, firewall, server, Windows event, cloud and Microsoft 365 or Google Workspace logs per client. Correlation rules are mapped to MITRE ATT&CK, and related alerts are rebuilt into a graph-based storyline, so an analyst can see which host, account and outbound connection came first. That is how the detection clock starts at the attacker’s first move rather than when someone opened a ticket. Tiered hot, cold and archive retention keeps the evidence behind last quarter’s numbers available, and supports CERT-In’s direction to keep 180 days of logs in India.
Ora’s SOAR runs visual playbooks with pre-built connectors for firewalls such as FortiGate, Palo Alto, Sophos, Check Point and Cisco ASA, EDR tools such as CrowdStrike, SentinelOne and Microsoft Defender, ticketing in ServiceNow and Jira, and alerts to Teams, Slack, email and PagerDuty. Pushing a blocklist to FortiGate or isolating a host becomes a timed, logged step, which turns containment time into a measured number. The same automation is what makes CERT-In’s six-hour reporting window realistic.
The NMS gives one view of firewalls, switches, access points and WAN or SD-WAN links, with LLDP and CDP topology discovery, path tracing, ML-based anomaly detection and auto-healing policies. On a multi-vendor estate, that is how a branch firewall that went quiet three weeks ago shows up before the auditor finds it. AIOps features such as alert-fatigue reduction and anomaly clustering also keep the alert layer small enough that analysts look at what matters.
For plants, warehouses and retail chains, video surveillance (VMS) adds ONVIF, Hikvision and Dahua cameras with video analytics to the same operations view, so physical incidents can sit in the same register. The platform helps you evidence these metrics; the definitions and thresholds remain your leadership’s call.
Quarterly is the usual rhythm for a board or audit committee, with a monthly version for the CIO and CISO that carries more operational detail. Add an out-of-cycle note after any incident that was reportable to a regulator or that affected customers. Directors shouldn’t learn about a serious incident from the next scheduled pack.
Not quite, and mixing them causes arguments. Containment means the attacker can no longer act: account disabled, host isolated, traffic blocked. Response or recovery usually runs longer, covering clean-up, restoration and root cause. Boards care most about containment, because it limits damage. Report recovery separately for incidents that hit production or customer services.
Usually not as it stands. Provider reports are written for the IT team and lean towards volume and ticket statistics. Ask your provider to deliver the specific metrics and definitions you agreed, and write those definitions into the contract or service schedule. Then your CISO adds business context and the actions being taken.
There’s no benchmark that transfers cleanly between companies, because definitions differ so much. Set your own baseline over two quarters, then target steady improvement for high and critical incidents. One external anchor does apply: if detection is slow, CERT-In’s six-hour reporting window starts eating into the time you have to investigate.
Before redesigning any dashboard, take the three most serious incidents from last quarter and reconstruct them by hand: when the first malicious event happened, when the SOC noticed, when it was contained, and who would have signed a CERT-In report. That exercise will tell you which of your current numbers are real and which definitions need fixing.
If you’d like a second pair of eyes on it, our managed SOC services team can run that review with you and help draft a board pack your directors can act on. It usually starts with a short call about what your board is asking today.