- Join Our Company
- Email: sanjay@pjnetworks.com
- Phone: +91-9818361787


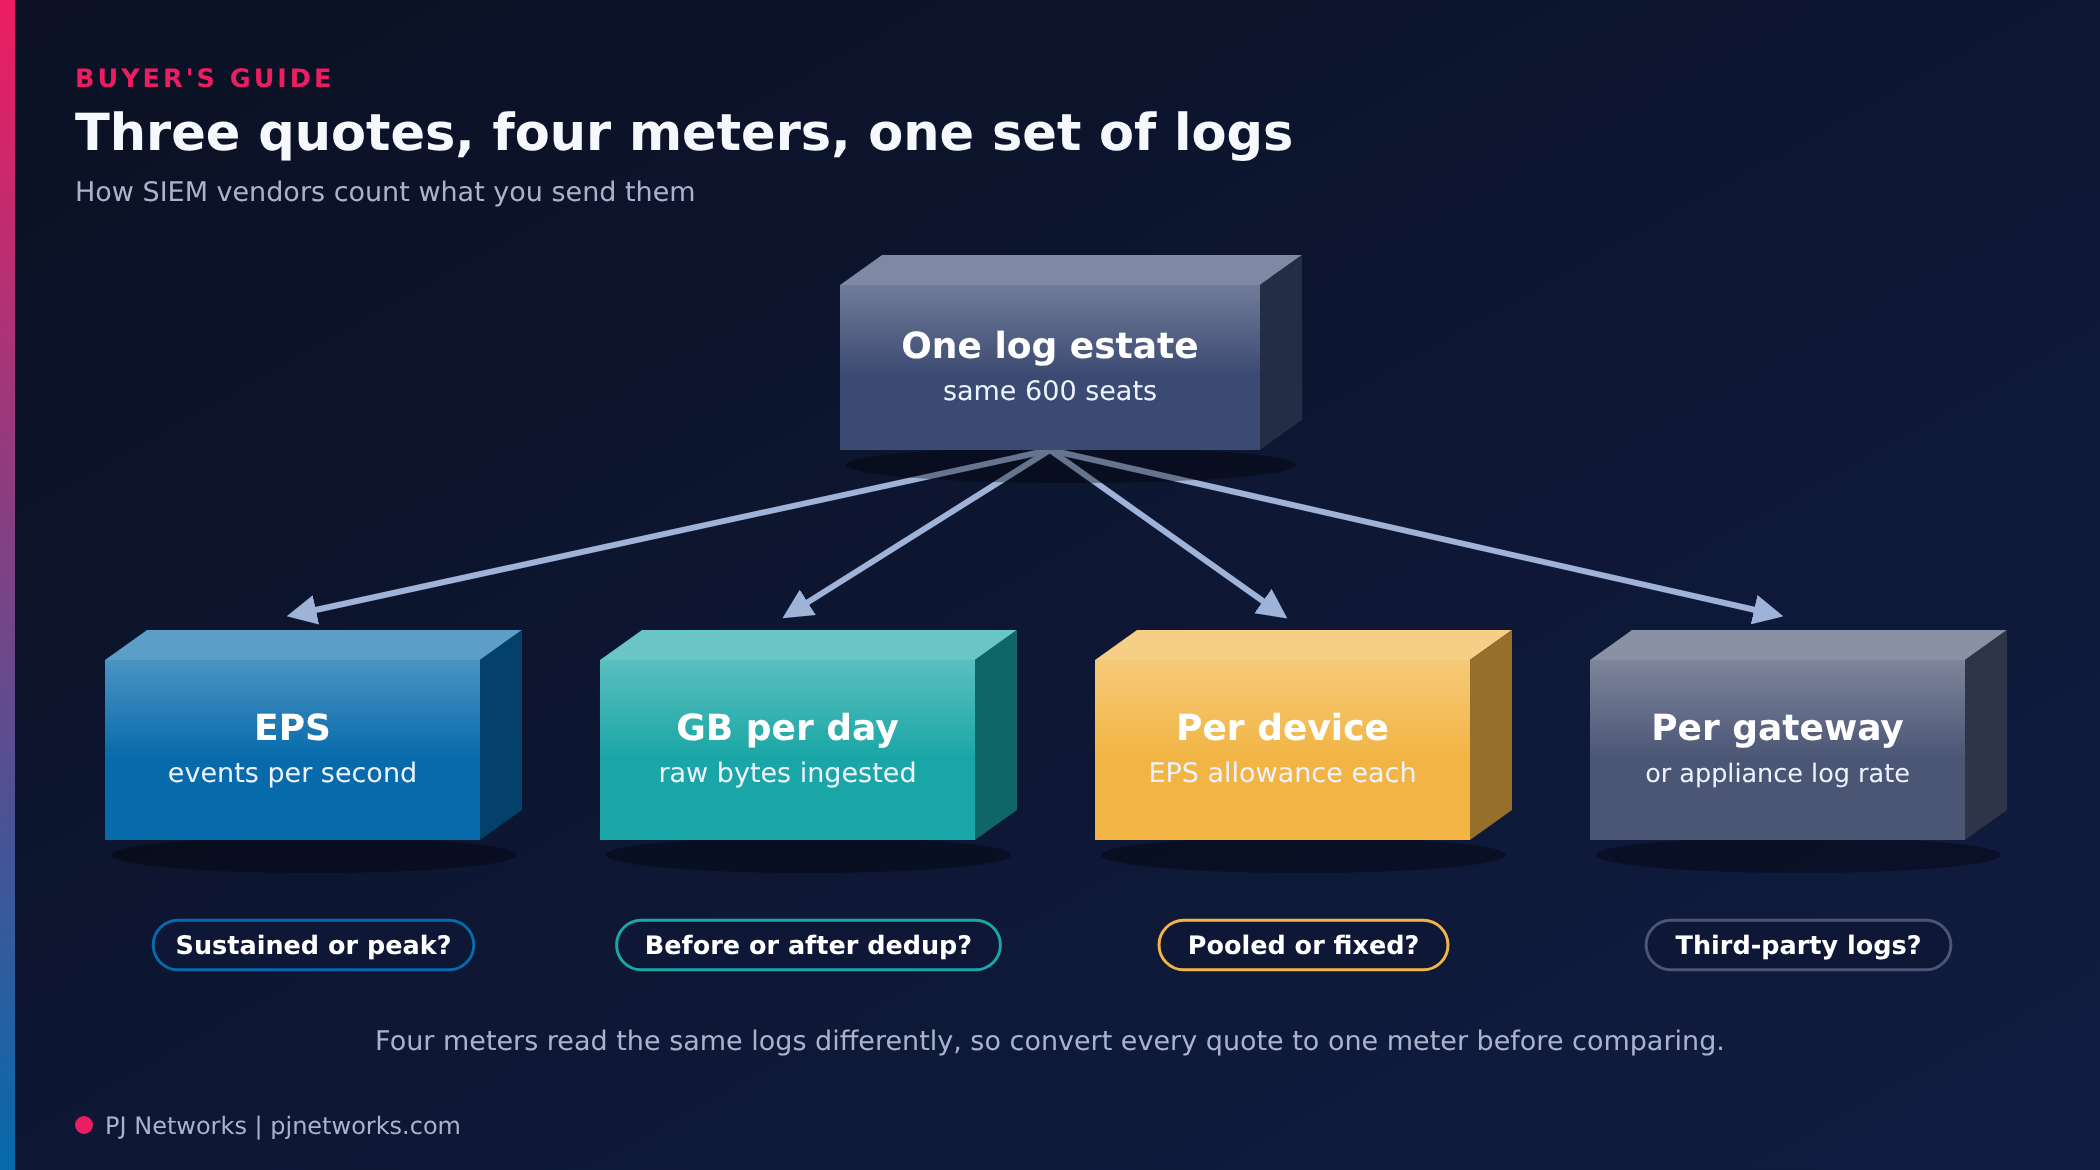
Ask three SIEM vendors to quote for the same company and you’ll often get three numbers that can’t be compared, because each one is counting something different. One prices by events per second, one by gigabytes a day, one by the number of devices that send logs. SIEM EPS sizing is where that confusion starts, and in many of the proposals we’re asked to review it was done with a device list and a rule of thumb.
We size, deploy and run log platforms for clients from our NOC in Delhi. The only estimate we trust is one built from a week of the client’s own traffic. Anything else is a guess with a purchase order attached.
The short answer: collect at least seven days of logs from every source you plan to onboard, count events per second for each source, find the busiest combined minute instead of adding up individual peaks, add growth headroom, then convert the average to gigabytes per day and multiply by your retention period. Compare vendor quotes only after you’ve done this, and on the same meter.
EPS, or events per second, is the oldest SIEM meter. It counts individual log records arriving at the collector, and it’s how most on-premises products size their hardware. Volume pricing counts raw gigabytes ingested per day, which is how cloud SIEMs bill. Device or node pricing counts how many things send logs, usually with an EPS allowance attached to each one.
Real examples make the difference clearer. Fortinet’s own FortiSIEM licensing guide describes an all-in-one perpetual base licence covering 50 devices and 500 EPS, a per-device subscription that carries 10 EPS per device, and a separate raw-volume model in GB per day for on-premises virtual machines. Microsoft’s Sentinel billing documentation charges analytics ingestion per GB, with commitment tiers that start at 100 GB a day. Check Point’s SmartEvent datasheet licenses a dedicated SmartEvent server by the number of gateways whose logs it analyses, and rates each Smart-1 appliance by indexed logs per second.
None of these is wrong. They just reward different log profiles, and a mid-market Indian estate with one noisy firewall pair and two hundred quiet switches will look cheap on one meter and expensive on another.
| Meter | What it counts | Where it bites | What to ask the vendor |
|---|---|---|---|
| Events per second | Log records per second at the collector | Burst traffic, chatty firewalls, logon storms at shift change | Sustained or peak? What happens above the licensed rate? |
| GB per day | Raw bytes ingested daily | Verbose formats (JSON cloud logs, long Windows events) | Is it measured before or after filtering and deduplication? |
| Per device | Number of log-sending assets, with an EPS allowance each | One firewall can send more than fifty printers combined | Is the allowance pooled across devices or fixed per device? |
| Per gateway or appliance | Firewalls analysed, or the box’s rated log rate | Growth means a bigger appliance, not a licence top-up | Which third-party sources does it correlate at all? |
A device list tells you what exists. It doesn’t tell you that your perimeter firewall logs every allowed session because someone ticked “log all” during a troubleshooting call in 2023 and never unticked it. Only the logs tell you that.
Picture a 600-seat pharmaceutical distributor near Ahmedabad: a head office, two warehouses on mixed ISP links, a Check Point gateway cluster at the head office, Windows domain controllers, an EDR agent on laptops and Microsoft 365. One network engineer, one systems admin, and an audit due in March. Here’s the order we’d follow with them.
Why a full week? Because Sunday at a warehouse and Monday at 9:15 are different companies. An estimate built from a quiet Tuesday afternoon will undercount, and the shortfall tends to surface in the middle of a renewal year, when it’s hardest to fix.

The figures below are illustrative. They’re the kind of shape we’d expect from the hypothetical distributor above, and they’re here to show the arithmetic, not to be copied into a tender.
| Source | Average EPS | Peak EPS (own peak) |
|---|---|---|
| Perimeter firewall cluster | 900 | 2,400 |
| DNS servers | 300 | 900 |
| Domain controllers | 250 | 700 |
| Windows member servers (about 40) | 200 | 500 |
| EDR telemetry | 150 | 400 |
| Switches and access points | 40 | 150 |
| Microsoft 365 and cloud audit | 30 | 120 |
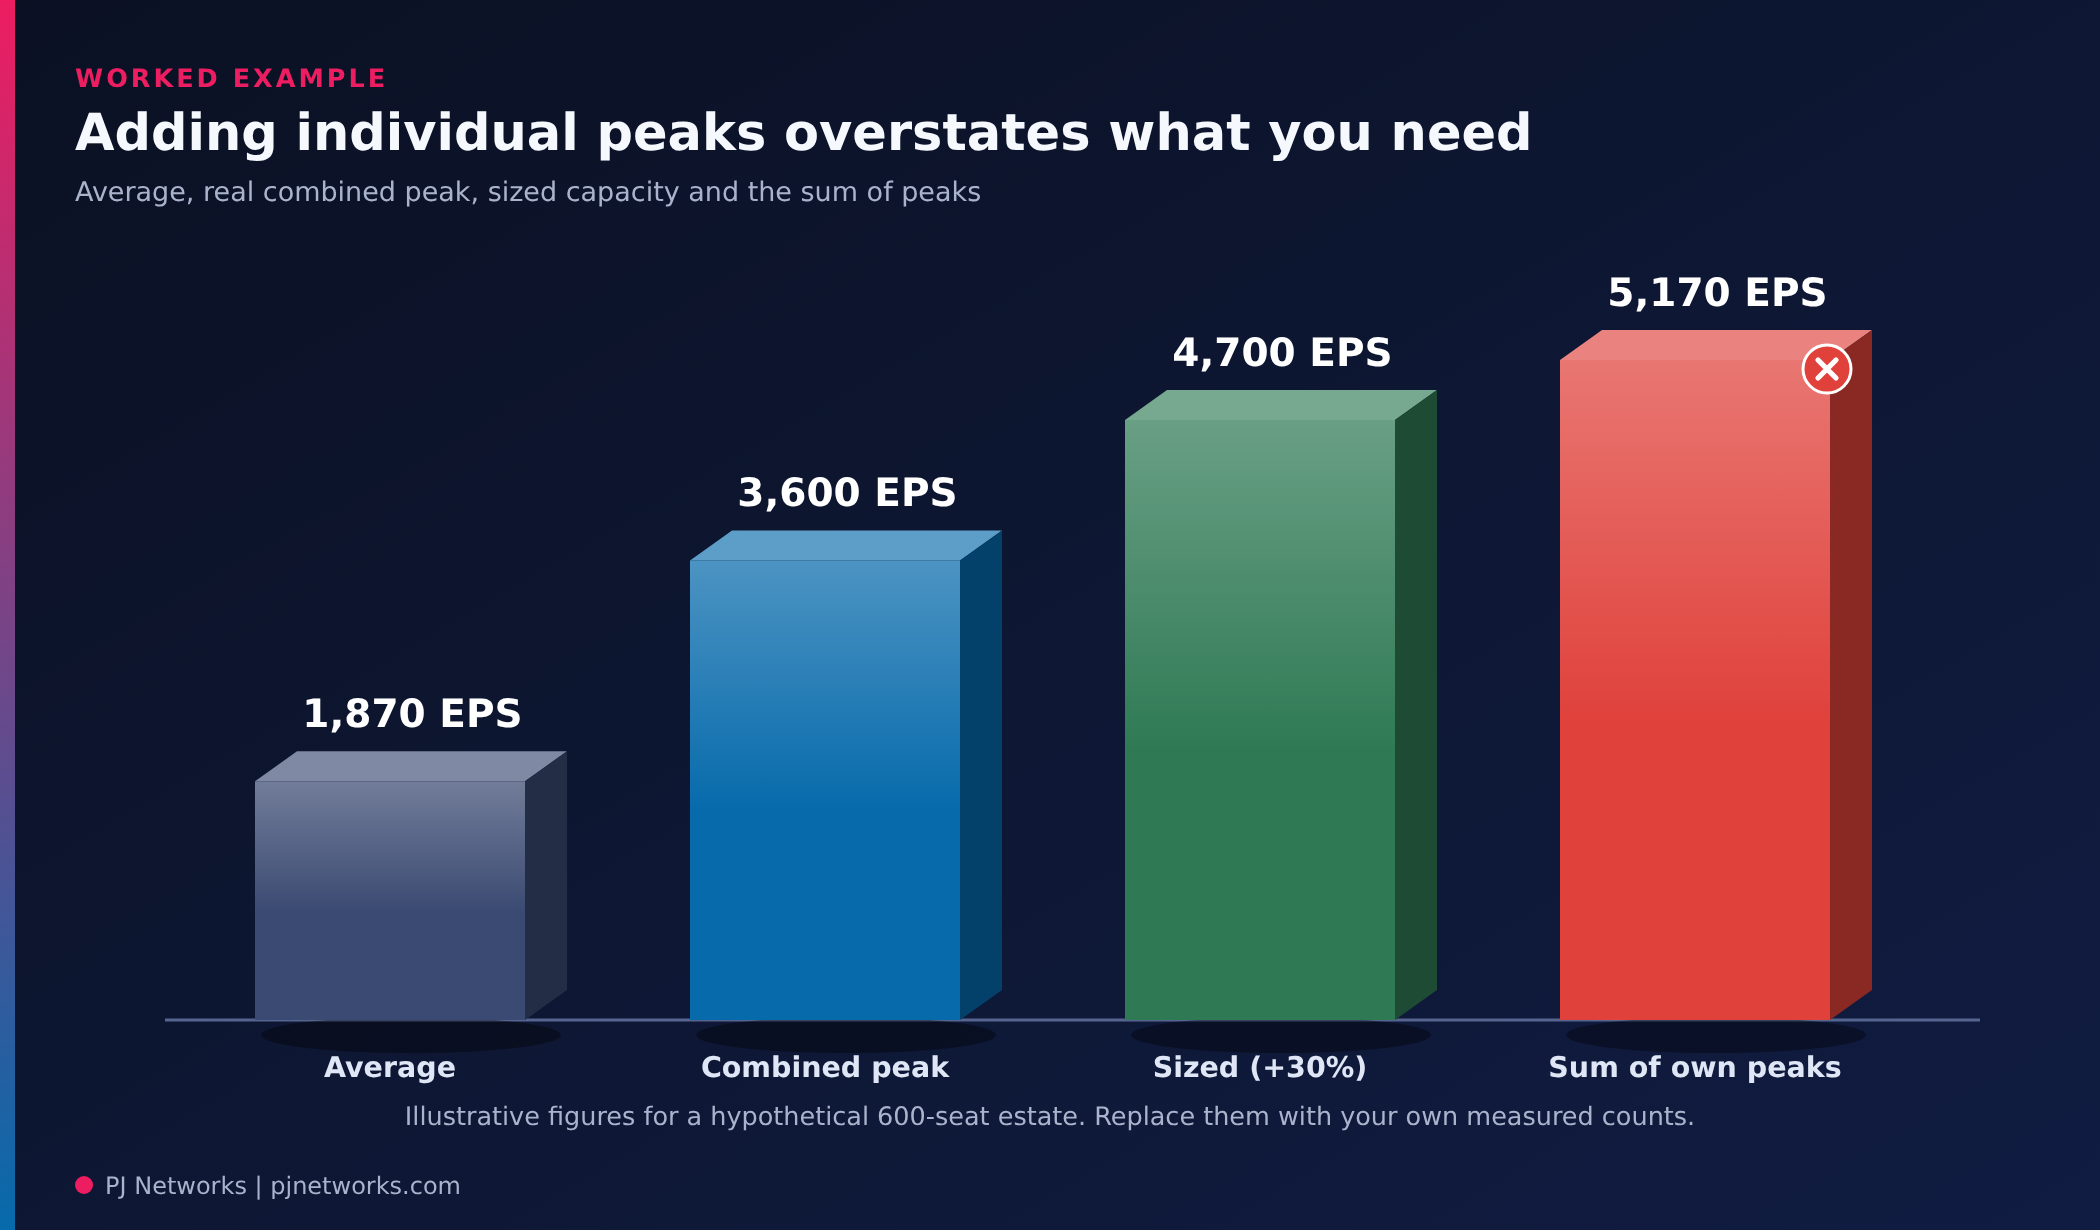
| Total | 1,870 | 5,170 if you add the peaks |
Adding up each source’s own peak gives 5,170 EPS. But those peaks don’t happen in the same minute. The firewall peaks at lunch, the domain controllers at shift change, the servers during the patch window. In our example the busiest combined minute measured 3,600 EPS. Add 30% headroom for two years of growth and you’d size for roughly 4,700 EPS of sustained capacity.
Now the storage side. At an average of 1,870 EPS, the estate produces about 161.6 million events a day. If the average message is around 500 bytes (measure yours, don’t borrow this), that’s roughly 81 GB of raw logs a day, and about 14.5 TB over 180 days before compression. That 180-day figure isn’t arbitrary in India, which we’ll come to.
An EPS-licensed vendor will look at 4,700, a volume-priced one at 81 GB a day, a per-device one at your asset count. Put all three on one sheet and the quotes finally line up.
Four sources account for most of the surprise in the estates we onboard. Firewall allowed-traffic logs are the biggest, especially internal east-west rules logging every session between VLANs. DNS query logs come next; they’re gold for spotting command-and-control beacons and painful for licence counts. Windows event 5156 (Filtering Platform connection allowed) can flood a domain controller’s output if advanced audit policy was switched on wholesale. And debug-level syslog from switches, left on after a fault was fixed, adds volume with no security value at all.
The tempting fix is to filter all of it out at the collector. Here’s where it usually goes wrong. Filters added at sizing time get forgotten, and four months later an investigation needs the allowed-traffic records for one server, and they were never kept anywhere.
CERT-In‘s directions of April 2022 ask service providers and body corporates to keep logs of all their ICT systems securely for a rolling 180 days within Indian jurisdiction, and to produce them when asked. The direction doesn’t say those logs must sit in the SIEM. So our position is simple: filter noise out of the detection tier if you must, but route it to cheaper storage you can still search. We cover the retention side in detail in our post on firewall log retention in India, and the reporting clock in our guide to CERT-In’s six-hour incident reporting window.
What would we skip outright? Switch debug logs, load balancer health checks, and duplicate copies of one event arriving from both a forwarder and the device.
If your log profile is steady and dominated by on-premises appliances, EPS licensing is predictable and easy to budget in lakh per year. If you’re heavy on Microsoft 365, AWS or Azure, volume pricing usually fits better, because cloud audit logs are long but infrequent. Per-device pricing suits estates with many quiet devices and few noisy ones, which describes plenty of plants and hospitals.
The question that matters more than the meter is what happens when you exceed it. FortiSIEM’s raw-volume model, for example, disables the Analytics and Dashboard pages for a day if the daily limit is exceeded more than 11 times in a rolling 30 days. Fair enough, but you’d want to know it before a ransomware investigation doubles your log volume. Some products drop events, some queue them, some send an invoice.
Before you sign, get written answers to these:
If a vendor can’t answer the last two on one page, assume the first year’s quote is the cheapest year you’ll ever see. Our managed SIEM service page explains how we handle these questions when we run the platform for you.
PrahiX Ora is a unified SecOps platform built by PrahiX Tech Pvt Ltd, and PJ Networks is its primary field deployment and operations partner. For sizing conversations like this one, the product we deploy and operate for clients is PrahiX Uni, which puts monitoring, AIOps, SIEM, SOAR and self-healing in one product. Your firewalls, EDR and directory stay where they are; Uni sits beside them.
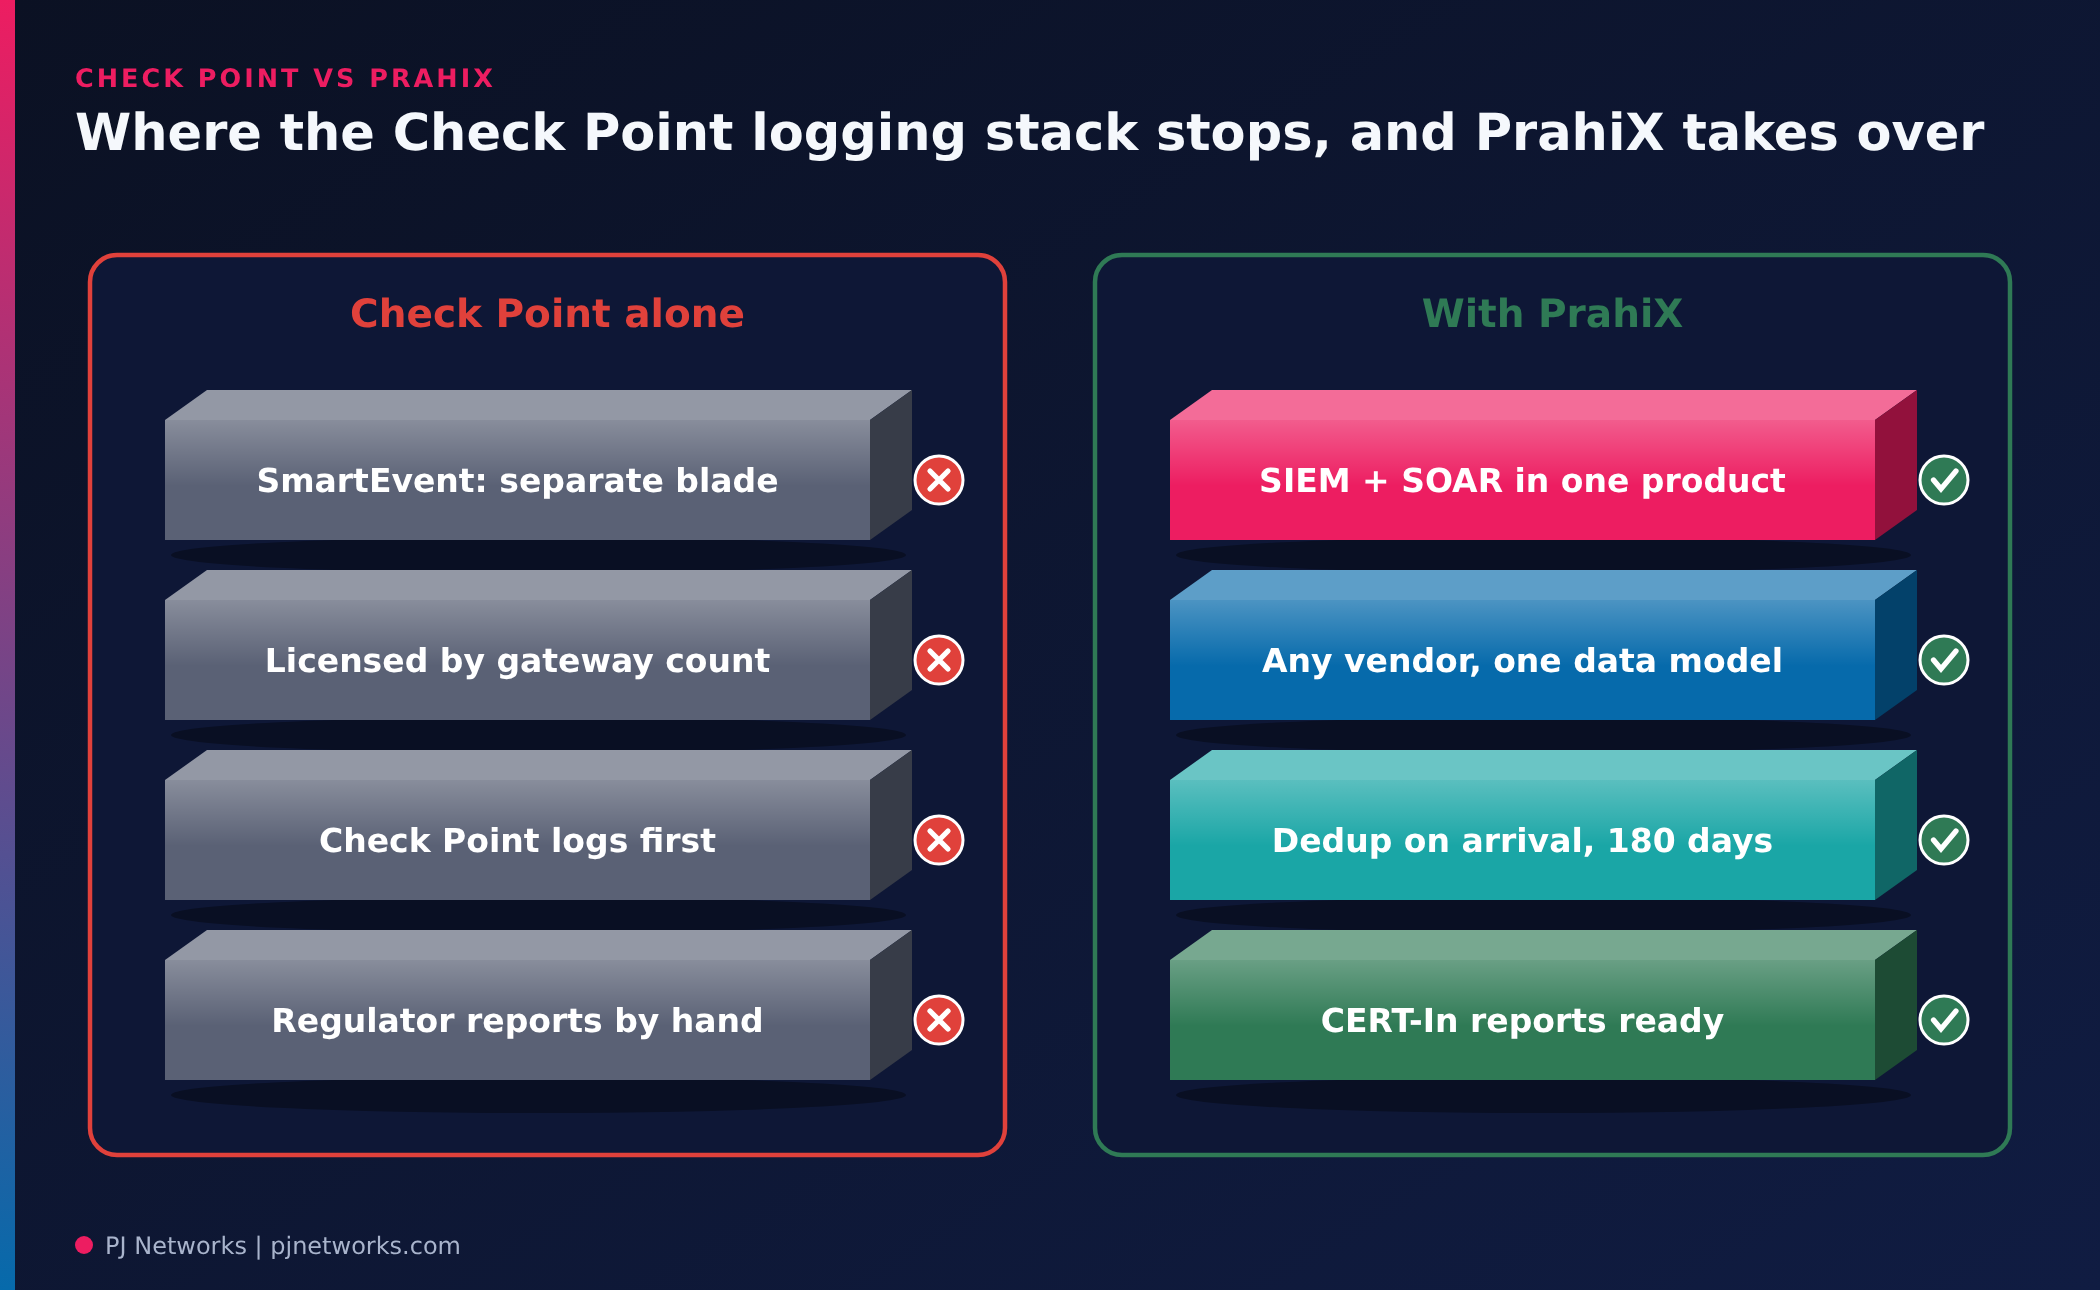
Check Point’s management stack is good at what it was built for: SmartConsole gives a clear view of gateway policy and logs, and SmartEvent turns Check Point logs into readable events. The limits show up when you size for a whole estate rather than for the gateways.
| With Check Point alone | With PrahiX |
|---|---|
| SmartEvent correlation is a separately licensed blade, and a dedicated SmartEvent server is licensed by the number of gateways it analyses | Uni is one product covering SIEM, SOAR, monitoring and AIOps, with no separate modules or add-ons to size |
| SmartEvent correlates logs from Check Point enforcement points; the console covers Check Point devices first | Pre-built connectors for FortiGate, Palo Alto, Sophos, Check Point and Cisco ASA, plus EDR, identity and cloud sources, on one data model |
| Capacity is tied to the Smart-1 appliance’s rated log rate, so growth means a bigger appliance | Logs are deduplicated on arrival and kept 180 days on tiered hot, cold and archive storage |
| Response at scale needs Infinity XDR/XPR, another subscription | Containment (isolate a host, revoke a token, block an address) runs on the same engine as detection, with approval gates |
| CERT-In and SEBI CSCRF submissions are usually assembled by hand | Compliance mapped to CERT-In 2022, SEBI CSCRF, RBI and IRDAI, with submission-ready reports |
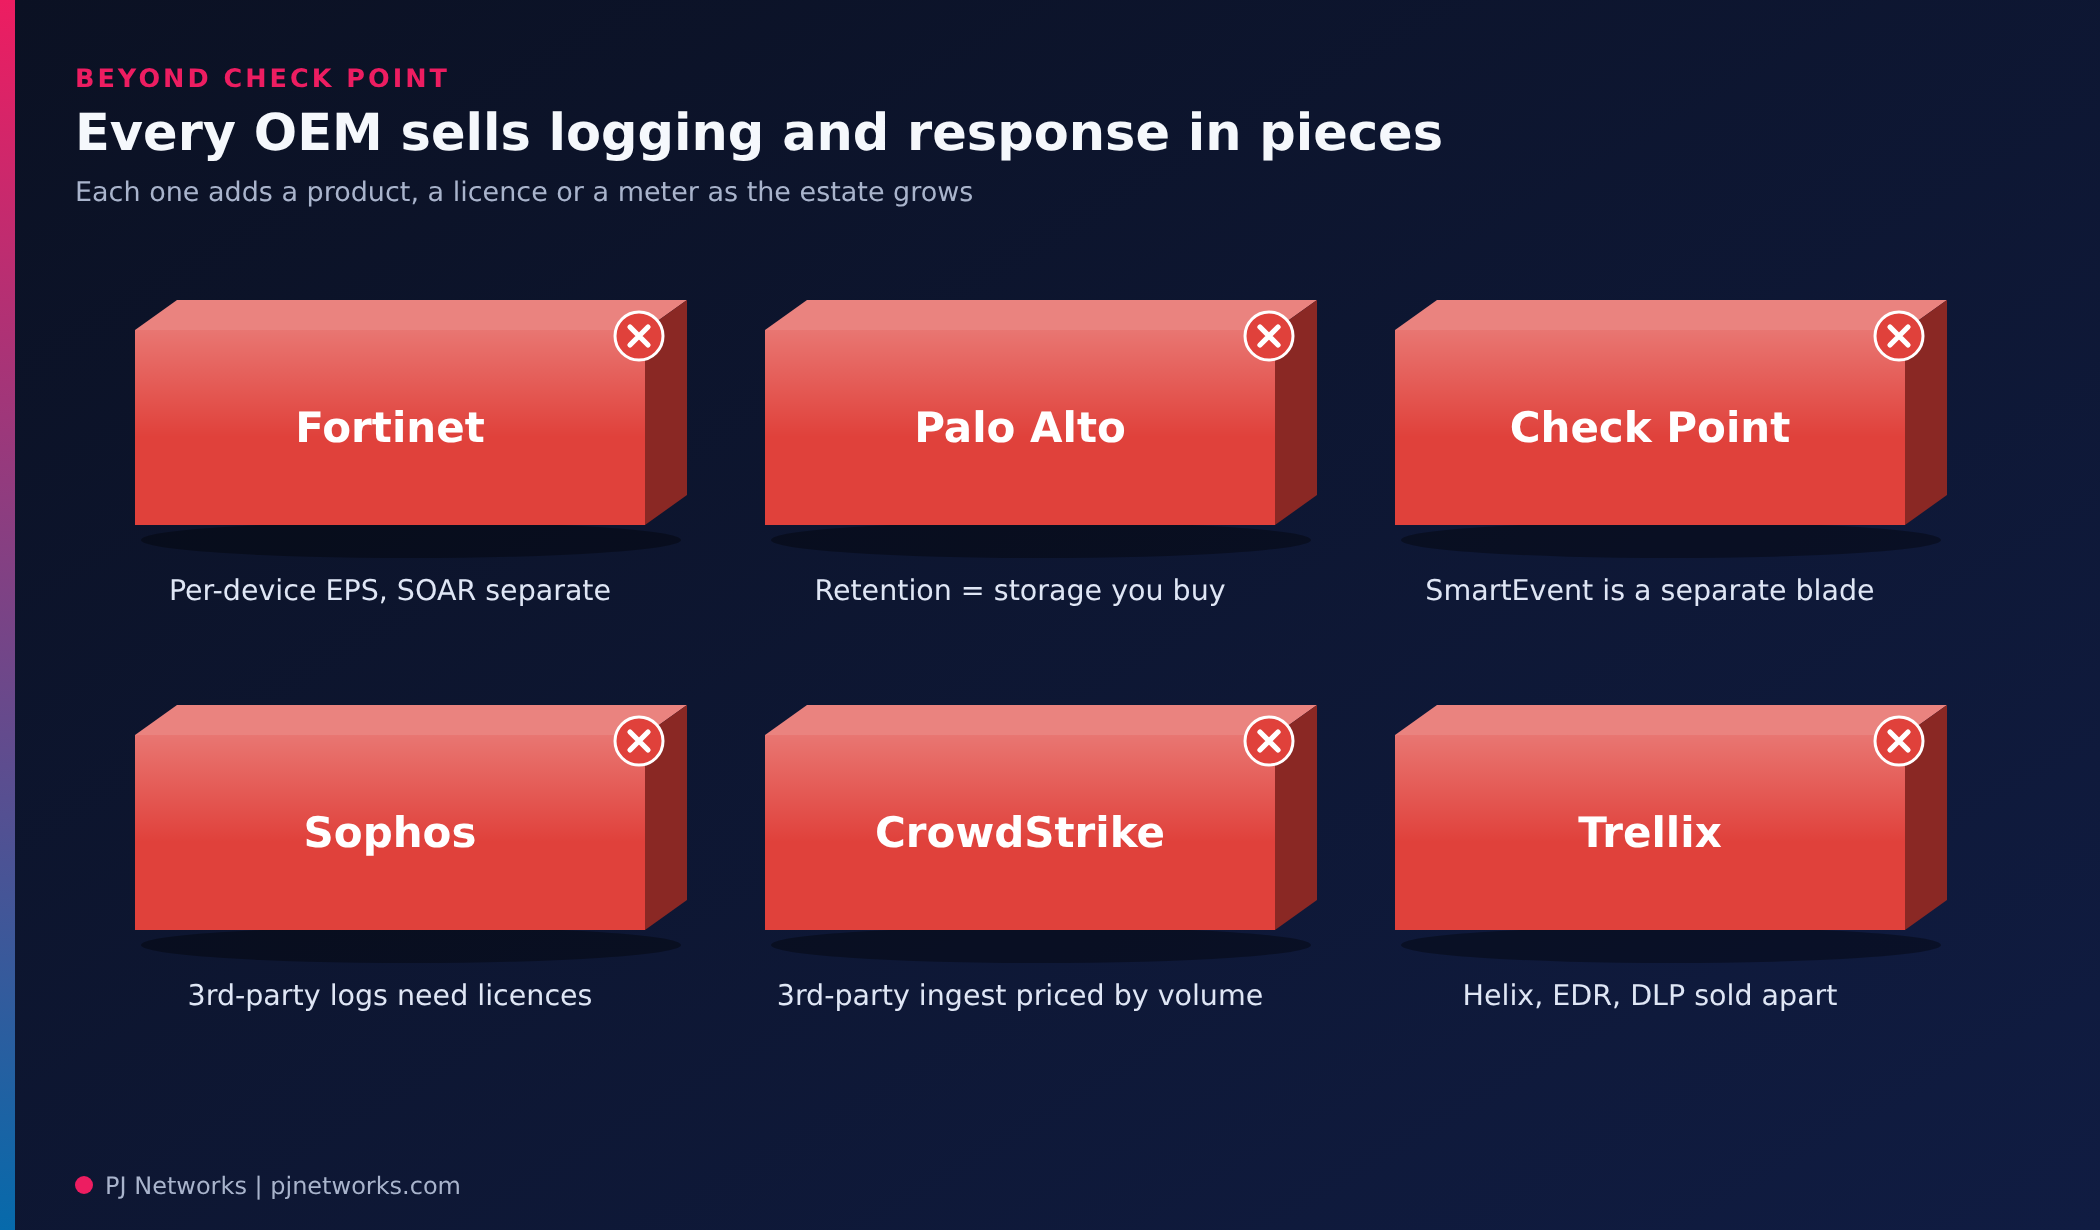
Every major vendor sells logging and response, and most of them sell it as several products with several meters. That’s why the comparison sheet in the previous section gets long so quickly.
| OEM | What you get, and where it stops |
|---|---|
| Fortinet | FortiSIEM licensed per device with an EPS allowance, or by raw GB per day; FortiSOAR and FortiEDR are separate products with their own licences |
| Palo Alto Networks | Strata Logging Service retention depends on the storage purchased; Cortex XDR, XSOAR and XSIAM are separate products |
| Check Point | SmartEvent is a separately licensed blade; Infinity XDR/XPR is another subscription |
| Sophos | XDR and MDR are built on Sophos telemetry first; third-party sources need integration licences |
| CrowdStrike | Falcon Next-Gen SIEM is a module with third-party ingestion licensed by volume; firewalls and switches can’t run the agent |
| Trellix | Helix, Trellix EDR and Trellix DLP are separate products under the XDR umbrella; network device health is outside scope |
| PrahiX | One engine reads all of the above, plus switches, ISP links and cloud, with detection, response and retention in one product |
Earlier we argued for routing noise to cheaper storage instead of deleting it. Uni does that natively: syslog, Windows events, DNS, NetFlow, cloud and SaaS audit logs and endpoint telemetry are deduplicated on arrival and typically searchable within about ten seconds. The duplicate forwarder-plus-device copies we mentioned simply stop counting twice. Detections are Sigma-based and mapped to MITRE ATT&CK, so DNS logs you keep earn their place by feeding kill chain tracking and UEBA risk scoring.
Two items from the checklist above, retention and behaviour under load, are where most quotes go vague. Uni keeps logs for 180 days on tiered storage, which supports CERT-In’s in-country retention direction, and CERT-In advisories are ingested automatically. Network telemetry (interface counters, flow records, device health) sits beside the security logs, so when a failed uplink causes a burst, topology-aware correlation cuts alert noise by up to 70% rather than paging the SOC for every downstream device. You can see how we run it day to day on our PrahiX Ora SIEM and SOAR page, and the engine itself on PrahiX’s SIEM + SOAR integration page.

RAYA AI, the agent inside Ora, writes the incident narrative and executive summary from the same logs you just sized, which shortens the report your board asks for (our post on SOC metrics for board reporting shows what belongs in it). PrahiX Data Protection adds a DPDP consent ledger and live breach clocks on the existing endpoint agent. PrahiX Guest keeps guest Wi-Fi login records on premises for the same audit. And the camera monitoring system, PrahiX’s video surveillance (VMS), puts camera and access-control events on the same timeline, so a warehouse door alarm and a firewall alert can be read together.
There’s no honest single figure. Two companies of the same size can differ several times over, mostly because of firewall logging settings and Windows audit policy. A company that logs only denied traffic and key Windows events will sit far lower than one logging every allowed session. Measure for a week; it costs less than one wrong licence tier.
Usually, but not always. Some products count a multi-line event once, others count each line. Some measure before parsing and deduplication, others after. Check Point rates appliances in indexed logs per second, which is close but not identical. Ask each vendor exactly where in the pipeline their counter sits, and get it in writing.
The 2022 direction requires logs of ICT systems to be maintained securely for a rolling 180 days within Indian jurisdiction. It doesn’t name the system that holds them. A cheaper archive tier works if you can retrieve and hand over logs promptly. This is a reading of the direction, not legal advice, so confirm with your compliance team.
Both, for different purposes. Size collector and processing capacity for the busiest combined minute plus headroom, because that’s when detections matter. Size storage from the daily average multiplied by retention. Size the licence by reading the overage rules: a product that drops events at peak needs a bigger margin than one that queues them.
This week, stand up a temporary collector, point your firewall, domain controllers and DNS servers at it, and let it run until next Monday. You’ll walk into every vendor meeting with your own numbers, and the quotes will finally be comparable.
If you’d like a second pair of eyes on the counts, or want us to run the measurement week for you, our managed SOC team does this as part of every onboarding. We’ll tell you what we’d filter, what we’d keep, and what we’d leave alone.